
|

|
|
|
|
|
|

|
|
| OCEAN DYNAMICS
LABORATORY
Research Projects:
Rich Pawlowicz's Matlab Toolboxes |
OCEAN DYNAMICS LABORATORY Prof. Rich Pawlowicz Phone: (604) 822-1356 |
Faculty Current Graduate Students Past Graduate Students Research Associates Undergraduate Students |
To really understand what this amplification factor is (and why), we have to understand the processes of mixing. There are different kinds of mixing - we need to understand things like where, and how much, and when it occurs. Much of the mixing happens in the Gulf Islands region. But should we consider the islands to act as a kind of "egg-beater" as the tides slosh water back and forth? Should we rather think of the mixing as being driven by bottom turbulence? Or is something else important? The bathymetry is dominated by two sills; this has led to speculation that a physical process known as hydraulic control(and the turbulence generated in the hydraulic jumps downstream of the control) may be important.
These are important questions. Unfortunately, they are also difficult to
approach directly. The intense turbulence that occurs in this region manifests
itself on many scales.  This picture shows a ``boil''
some 20m across occuring at the meeting of two streams as they join in the
lee of an island. Such features are sometimes powerful enough to spin large
ships around, and their time scale is measured in minutes! Because
of this variability direct measurements (e.g. from current meters) are not
necessarily useful for understanding the larger scales (for more information
about what causes these boils see Farmer, Pawlowicz, and Jiang, Dynamics
of the Ocean and Atmosphere, 2002).
This picture shows a ``boil''
some 20m across occuring at the meeting of two streams as they join in the
lee of an island. Such features are sometimes powerful enough to spin large
ships around, and their time scale is measured in minutes! Because
of this variability direct measurements (e.g. from current meters) are not
necessarily useful for understanding the larger scales (for more information
about what causes these boils see Farmer, Pawlowicz, and Jiang, Dynamics
of the Ocean and Atmosphere, 2002).
To look at the big picture new ideas are called for!
 During a field
program in 1996, I noticed that plots of temperature vs. salinity
During a field
program in 1996, I noticed that plots of temperature vs. salinity 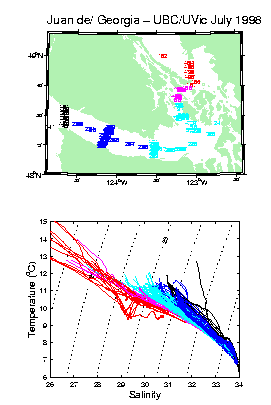 for the waters in this region showed an interesting curved nature.
A simple mixing process would result in a straight T/S correlation. Analysis
of this data [Pawlowicz and Farmer, J. Geophys. Res. , 1998] indicates
that this curved nature arises from the effects of surface heating, and gives
us a handle on trying to estimate bulk mixing rates. In the summer of 1998
I went back into the field to get more data on this effect, and to extend
the results over a wider area. The figure at right shows the
results. Individual vertical profiles are colour-coded from red (Strait
of Georgia) to black (near the mouth of Juan de Fuca Strait). Notice
that the slope of the black curves is steeper than the red ones. Using
this data as well as some mathematical theory developed for this problem
calculated the average in- and out-flow at various points in
this region, as well as estimates of bulk mixing [Pawlowicz, Estuarine Coastal
and Shelf Sciences, 2001].
for the waters in this region showed an interesting curved nature.
A simple mixing process would result in a straight T/S correlation. Analysis
of this data [Pawlowicz and Farmer, J. Geophys. Res. , 1998] indicates
that this curved nature arises from the effects of surface heating, and gives
us a handle on trying to estimate bulk mixing rates. In the summer of 1998
I went back into the field to get more data on this effect, and to extend
the results over a wider area. The figure at right shows the
results. Individual vertical profiles are colour-coded from red (Strait
of Georgia) to black (near the mouth of Juan de Fuca Strait). Notice
that the slope of the black curves is steeper than the red ones. Using
this data as well as some mathematical theory developed for this problem
calculated the average in- and out-flow at various points in
this region, as well as estimates of bulk mixing [Pawlowicz, Estuarine Coastal
and Shelf Sciences, 2001].
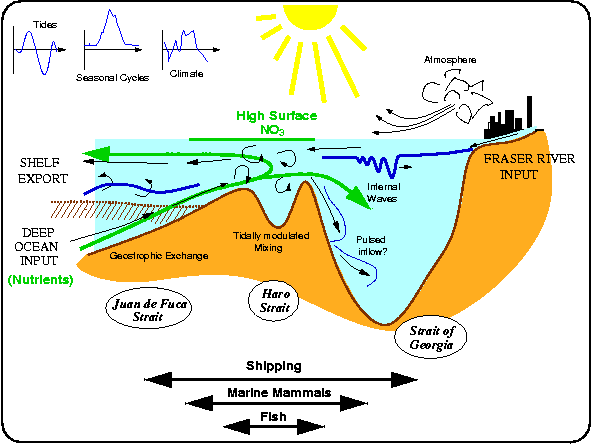
One exciting application of this work is to determine the fluxes of other materials - for example, the flux of nutrients. Currently we are trying to use this approach to get a better idea of what the seasonal changes are, and by measuring nutrients (nitrate, silicate, and phosphate) attempting to better understand changes in these biologically important parameters. During 2002-2006 I was one of the primary investigators in the Strait of Georgia Ecosystem Monitoring Project (STRATOGEM) [Pawlowicz, Halverson and Riche, Atmosphere-Ocean, 2007].
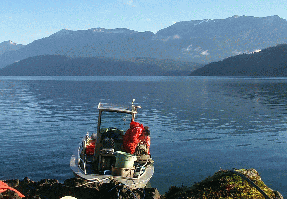
Recently this has has gotten me involved in a large multi-investigator project, the Rivers Inlet Ecosystem Study , in remote Rivers Inlet, BC, where we are trying to understand just why the salmon have stopped coming into what was until about 20 years ago the 3rd largest run of sockeye salmon in British Columbia.
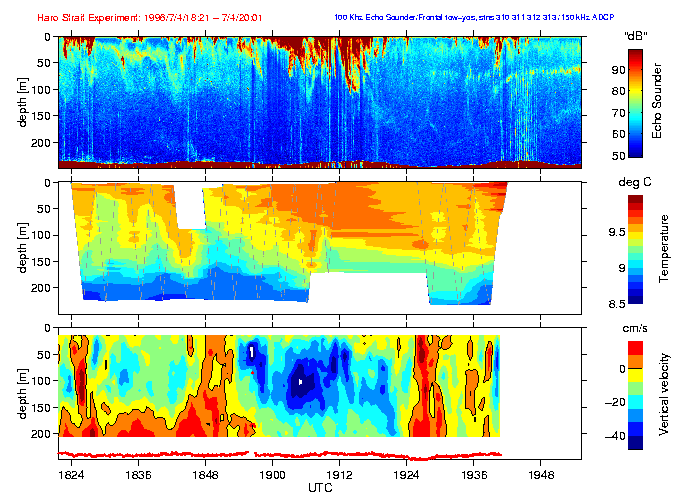 Here's an example, from data collected during
the Haro Strait
Experiment. The upper panel shows backscatter from a 100kHz echosounder
over a period of about 1 hour as we transit an area of boils. The red plumes
projecting downwards represent intense concentrations of bubbles sucked
down to 100m below the surface.The second panel shows temperatures, measured
by to-yo-ing a CTD. These bubble plumes are associated with warm surface
water (orange and red colours). The lowest panel shows vertical velocities
measured using an ADCP, with red for upward and blue for downward velocities.
Vertical velocities are greater than 50 cm/s in the intense plume at the
center of the strip, a very large number indeed!
Here's an example, from data collected during
the Haro Strait
Experiment. The upper panel shows backscatter from a 100kHz echosounder
over a period of about 1 hour as we transit an area of boils. The red plumes
projecting downwards represent intense concentrations of bubbles sucked
down to 100m below the surface.The second panel shows temperatures, measured
by to-yo-ing a CTD. These bubble plumes are associated with warm surface
water (orange and red colours). The lowest panel shows vertical velocities
measured using an ADCP, with red for upward and blue for downward velocities.
Vertical velocities are greater than 50 cm/s in the intense plume at the
center of the strip, a very large number indeed! 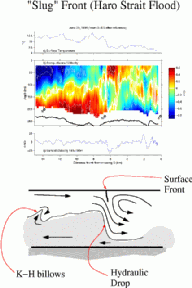 Recently, using a simple linear analysis, [Pawlowicz, JGR, 2002]
I found an internal tide of amplitude 1 m/s in velocity and 40m in height
in Haro Strait. I am very excited by this - you don't often get such simple
explanations for what looked like a very complicated set of observations.
However, the amplitude of the wave is big enough that nonlinrear effects
must be important. The picture at right shows an ADCP transect down through
the crest of this internal tide. It doesn't look like much, but in
fact it is telling us that a fascinating phenomenon called an internal
hydraulic drop is occurring.
Recently, using a simple linear analysis, [Pawlowicz, JGR, 2002]
I found an internal tide of amplitude 1 m/s in velocity and 40m in height
in Haro Strait. I am very excited by this - you don't often get such simple
explanations for what looked like a very complicated set of observations.
However, the amplitude of the wave is big enough that nonlinrear effects
must be important. The picture at right shows an ADCP transect down through
the crest of this internal tide. It doesn't look like much, but in
fact it is telling us that a fascinating phenomenon called an internal
hydraulic drop is occurring.
 Many of these complicated subsurface features have a surface expression
- like the boil shown above. In order to get a
better understanding of the shape an evolution of such features I have begun
experimenting with time-lapse photography
Many of these complicated subsurface features have a surface expression
- like the boil shown above. In order to get a
better understanding of the shape an evolution of such features I have begun
experimenting with time-lapse photography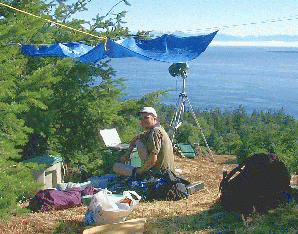 . It turns out that there are all kinds of interesting things occurring
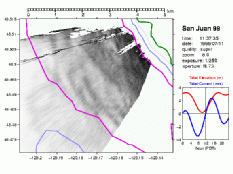
in Haro Strait! Clicking here or on the still image
at left will let you see a 2Mb MPEG movie of features near the southern
end of Haro Strait in July 1999 (Note - you need a full mpeg viewer
to correctly view this movie). The original images taken over a 7 hour
period have been rectified onto a map; the green line shows the SW coast of
San Juan Island and the magenta lines are the 250m isobaths on either side
of the deep channel. Tidal elevation and currents are shown at right.
Note the internal waves propagating across the Strait (diagonal dark lines
moving towards the upper right) near slack water, followed by a northward-travelling
"bore" near the coast during the flood tide. Thick fast-moving streaks are
freighters, thin streaks are smaller craft.
. It turns out that there are all kinds of interesting things occurring
in Haro Strait! Clicking here or on the still image
at left will let you see a 2Mb MPEG movie of features near the southern
end of Haro Strait in July 1999 (Note - you need a full mpeg viewer
to correctly view this movie). The original images taken over a 7 hour
period have been rectified onto a map; the green line shows the SW coast of
San Juan Island and the magenta lines are the 250m isobaths on either side
of the deep channel. Tidal elevation and currents are shown at right.
Note the internal waves propagating across the Strait (diagonal dark lines
moving towards the upper right) near slack water, followed by a northward-travelling
"bore" near the coast during the flood tide. Thick fast-moving streaks are
freighters, thin streaks are smaller craft.
 Currently Caixia Wang (Ph.D. Candidate) is trying to use this system
to understand the dynamics of internal wave propagation in the Strait of
Georgia. The thumbnail at left shows an aerial photo taken from 500m looking
down at an internal wave packet. Although internal waves are waves
on a deep density interface, they can be seen from the surface because they
change the surface waves overhead (making rough and smooth patches which
you can see in the upper part of the photograph, or because the water in
them is a different colour - the green lines at the bottom of the photograph).
The red dot at center left is the Coast Guard Hovercraft SIYAY (length 30m)
, outfitted with a CTD to measure temperature/salinity/density profiles,
as well as an Acoustic Doppler Current Profiler (ADCP) to measure currents
associated with these waves. If you click on the image you
can see the internal waves much more clearly.
Currently Caixia Wang (Ph.D. Candidate) is trying to use this system
to understand the dynamics of internal wave propagation in the Strait of
Georgia. The thumbnail at left shows an aerial photo taken from 500m looking
down at an internal wave packet. Although internal waves are waves
on a deep density interface, they can be seen from the surface because they
change the surface waves overhead (making rough and smooth patches which
you can see in the upper part of the photograph, or because the water in
them is a different colour - the green lines at the bottom of the photograph).
The red dot at center left is the Coast Guard Hovercraft SIYAY (length 30m)
, outfitted with a CTD to measure temperature/salinity/density profiles,
as well as an Acoustic Doppler Current Profiler (ADCP) to measure currents
associated with these waves. If you click on the image you
can see the internal waves much more clearly.
 In 2007 I was part of cruise to Knight Inlet, where I made many more
cool movies of internal waves being formed on
the famous sill there.
In 2007 I was part of cruise to Knight Inlet, where I made many more
cool movies of internal waves being formed on
the famous sill there.
 Lakes aren't oceans, but some of the lakes in the interior of British Columbia
can get pretty big. Working with R. Pieters of the Environmental Fluids Lab
we have been
Lakes aren't oceans, but some of the lakes in the interior of British Columbia
can get pretty big. Working with R. Pieters of the Environmental Fluids Lab
we have been Following this study, we investigated anoxic Nitinat Lake on the West Coast of Vancouver Island (which, despite its name, is actually a fjord filled with seawater). In collaboration with B. Laval (UBC Civil Eng.) and S. Baldwin (UBC Chem and Biological Eng.) we discovered how this fascinating system, which is 200m deep with deadly anoxic water coming as close to the surface as 3m in late summer (and, paradoxically, is the site of the largest chum salmon hatchery in Canada) "works" [Pawlowicz et al., Limnology and Oceanography, 2007].
More recently, I have been working in Powell Lake. Powell Lake looks
normal enough on the surface, and is about 50m above current sea level.
However, it contains seawater at the bottom of
two of its basins. This seawater was trapped after the coastal
land mass rebounded upwards at the end of the last ice age
about 10,000 years ago. This ancient seawater is filled with
various gases (water samples "fizz" like very smelly champagne),
and geothermal heat which result in double-diffusive layering
at depth.
|
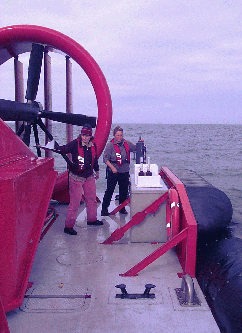
This is a project we have started at UBC to try
and understand the coupled biology and physics of the Strait of Georgia
and there is far more to say about it than I want to type here (but you
can see Shannon and Carla doing chemistry on the back deck of the hovercraft
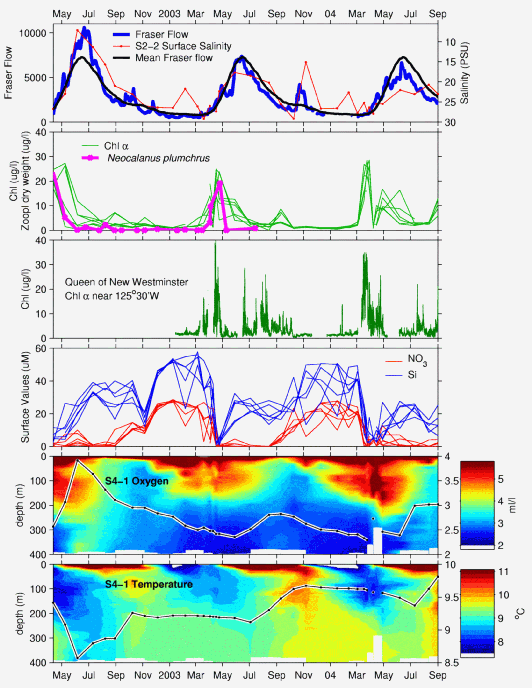
at left - hope they don't turn that fan on!). For more details see the Strait of Georgia Project Web page, www.stratogem.ubc.ca. Spring 2005...48 sampling trips into the Strait of Georgia and DONE!....data summary seen at right: |
|
Working in lakes and the ocean got me interested in trying to understand how these water conduct electricity. This may seem a bit odd, but in fact the electrical conductivity is proportional to the amount of dissolved ions in the water. In fact, measurements of conductivity are the primary (and often only) way that oceanographers and limnologists have to describe the salt content. But no-one really knows how to predict the conductivity for a given chemical composition - until [Pawlowicz, Limnology and Oceanography:Methods, 2008] which describes a numerical I model I wrote to do this.
This work has gotten me involved in SCOR Working group 127, and part of the team developing the new international Thermodynamic Equation of Seawater (TEOS-10) , now THE accepted method for the estimation of the properties of seawater!
Last changed 30/Aug/2013. Questions and comments to Rich Pawlowicz, mailto:rich@eos.ubc.ca